Cross-Sections
Existing cross-section data was provided for input into HEC-RAS. Data included older geometry files as well as a number of additional and updated cross-sections.
Both data sets were combined together to create new base cross-sections by replacing values within existing stations and interpolating any remaining unknown values (generally reach lengths).
Additional cross-sections were interpolated within HEC-RAS every three feet throughout the entire reach.
Shown below is an example of one of the cross sections. Beneath that, on the left, is the overall reach being studied with cross-sections before interpolation. Finally, the bottom right image depicts the reach after the 3-ft step interpolation was applied.


Peak Flows & Water Surface Elevations
To test flow conditions, estimates of peak flows and downstream water surface elevations for the 1-, 10-, 25-, 50-, 100-, and 200-year storms were made.
The USGS gauge #04071765 near Oconto Falls was used to obtain yearly peak flow data since 1988. The location can be viewed to the left.


The Green Bay East outlet at station 9087077, shown to the right, was used to obtain yearly peak water surface elevation data at the downstream of the Oconto River.
Raw data obtained for the historic peak flows and water surface elevations can be viewed below.


Frequency Analysis
Using the peak flows and water surface elevations determined above, a frequency analysis was conducted using the Log-Pearson Type III distribution to estimate the peak flows and water surface elevations for the 1-, 10-, 25-. 50-, 100-, and 200-year storms. The resulting estimations can be viewed below.


HEC-RAS Analysis
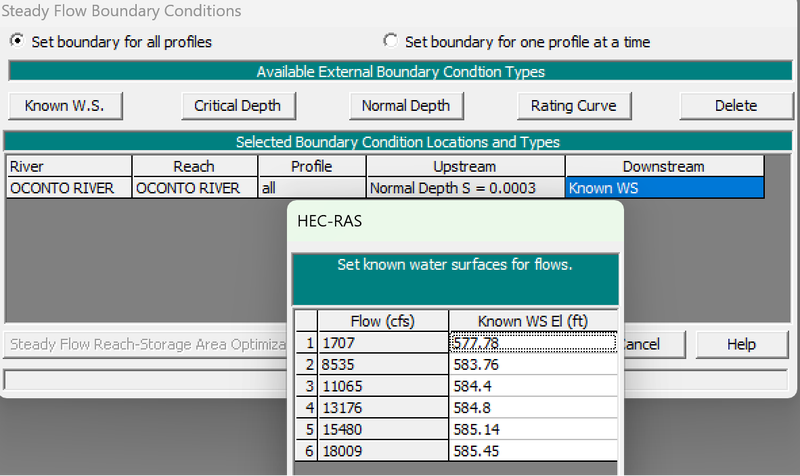
Using the peak flow and water surface elevations, a HEC-RAS analysis was conducted under steady flow conditions for the estimated flows and water surface elevations. The resulting water surface profiles and select cross-sections were then used for later analysis. The input of the flow rates can be observed below.

Using estimations from the cross sections, it was determined the channel had a mild slope of approximately 0.0003. As such, the upstream was bounded by the normal depth. The downstream was bounded by the estimated peak water surface elevations. The setup for the boundary conditions can be viewed to the right.
Channel Modifications
In order to investigate the effects of modifying the channel to be deeper and wider, the "Channel Design/Modification" tool was utilized to make extreme and idealistic trapezoidal cuts throughout the entirety of the channel. The same steady flow analysis with the same boundary conditions as above was conducted for the cut channel.
Cut dimensions were determined by viewing a few channel cross-sections at the upstream, midstream, and downstream ends to create arbitraty values that would both widen and deepen as many cross sections as possible. The inputs for this can be viewed below.

Comparisons
In order to quantify the flood potential and compare the results of the analyses before and after implementing the cuts, the average water surface elevations, average depths, and flood potential were determined.
The average water surface elevation was determined by taking the mean of the HEC-RAS generated water surface elevations for each storm condition. The average depth was then computed by taking the difference of these average water surface elevations and minimum channel elevations (to be conservative).
Finally, the flood potential was determined by taking the average water surface elevations and subtracting an observed minimum residential elevation obtained from google maps, shown below.

Comparisons within each reach condition (i.e. before or after cut) were made by computing the percent-change from previous storm condition for each parameter, as well as percent-change from the baseline 1-yr storm condition.
Water surface profiles were generated for both the initial and cut conditions to visually compare the changes that were quantified with tabulated data from HEC-RAS. Additionally, three cross-sections were used for to help convey the visual comparisons. The upstream-most, midstream, and downstream-most cross sections were utilized for this.
Create Your Own Website With Webador