HEC-RAS Visual Results
Water Surface Profiles
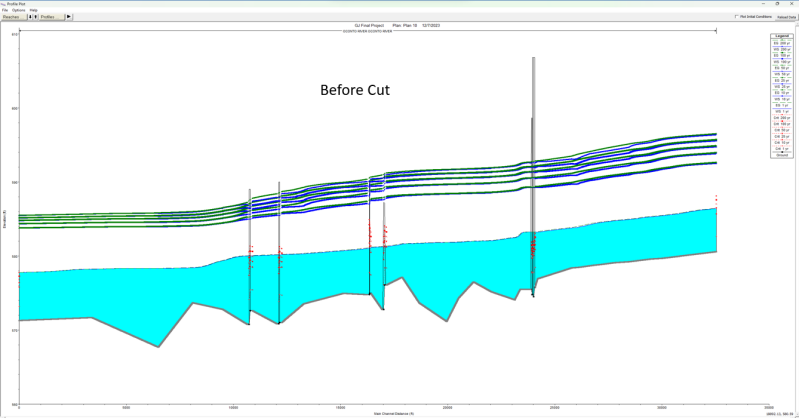
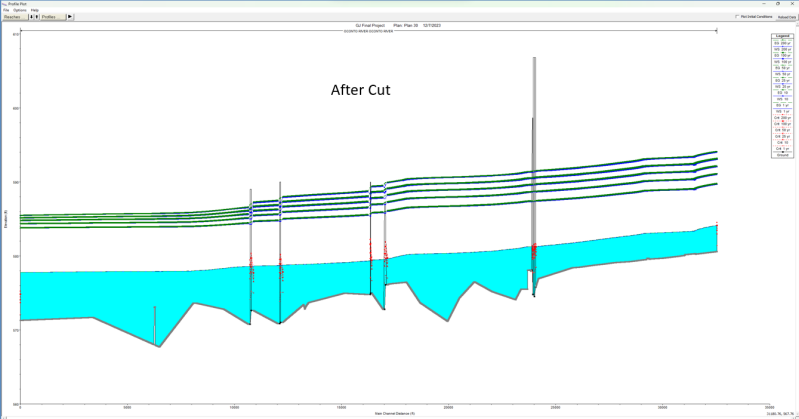
Seen below are the water surface profiles generated before and after the rectangular cut. It can be seen that following the 1-yr storm condition, there is a massive rise in the water surface elevations throughout the entire reach. With the downstream being bounded by the estimated water elevations, it can be seen that backwater effects worsen with each storm condition.
After the cut, it can be seen that the backwater effects are mitigated slightly, with observed reductions in water surface elevations for each storm condition upstream and encroaching on the midstream.
Oconto River Cross Sections:
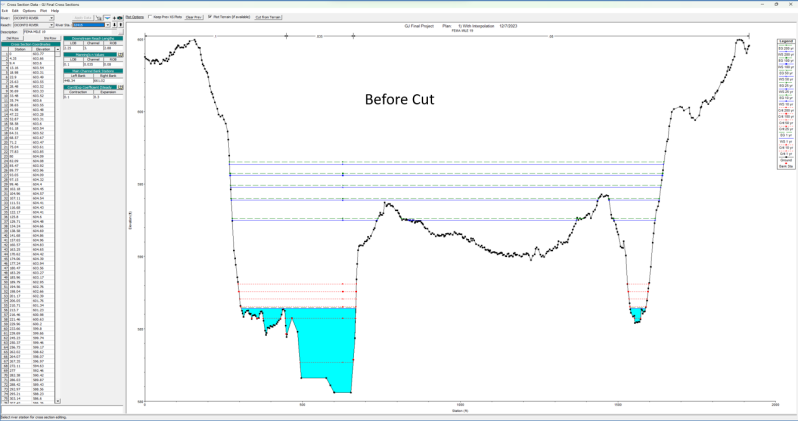
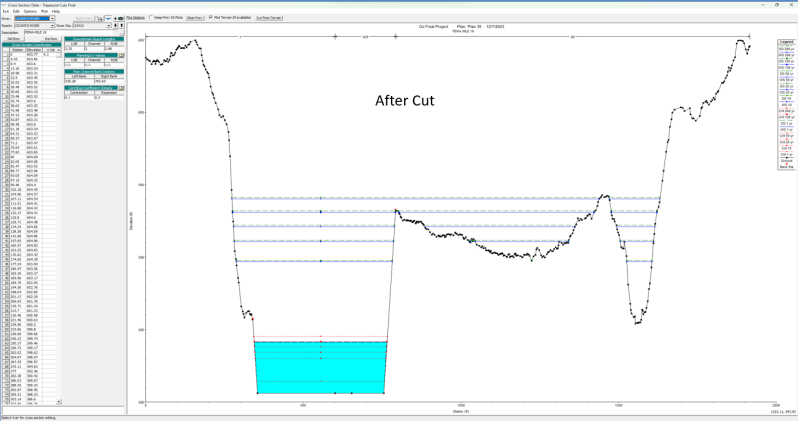
Below, the selected cross sections (upstream, midstream, and downstream) can be seen before and after the cut. Similar to the water surface profiles above, it can be seen that water levels rise dramatically following the 1-yr storm condition. Subsequent increases are more gradual, but still extreme. It can be seen in all cases past the 1-yr storm condition that the water surface far exceeds the overbank elevations.
Reductions in water surface elevations can be visually observed for each storm condition in the upstream and midstream cross-sections following the cut. Unlike these sections, the downstream end experiences little, to no reductions in water surface. This is in line with the fact the downstream was bounded by the estimated peak water surface elevations, and the notion that the cuts mitigated backwater effects slightly.
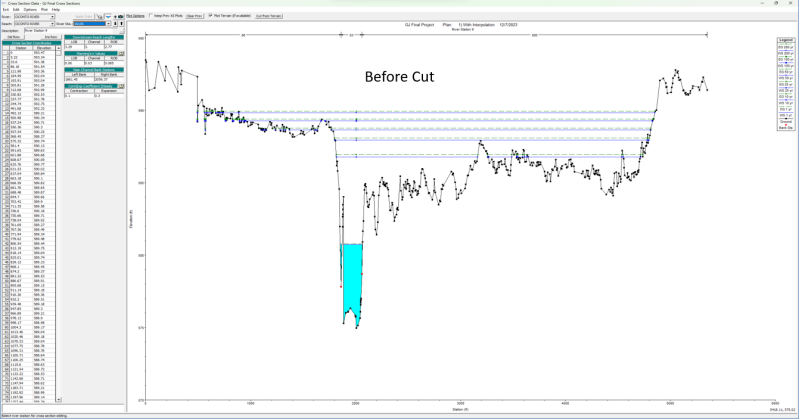

<-- Upstream -->
<-- Midstream -->
<-- Downstream -->


Tabulated Data
To quantify the changes observed visually, tabulated data from HEC-RAS was exported into excel for analysis as shown below.


It can be seen that overall, deepening and widening the channel with the use of trapezoidal cuts resulted in reductions in average water surface elevation, average depth, and flood potential.
Looking more closely at each individual condition, it can be seen that for both before and after the cut, percent changes from previous storm conditions decreased with each subsequent storm event, supporting the earlier notion that changes in the parameters tabulated above (average water surface elevation, average depth, and flood potential) were substantial for the 1 to 10 yr transition, and sequentially more gradual.
When compared to the baseline 1-yr storm event, the percent changes increase with each storm event. This highlights the future dangers and threats these events have to the Oconto River and surrounding areas. A direct comparison between the initial and cut conditions highlights how channel modifications could potentially help mitigate these dangers.

As can be seen, each category experienced reductions for every storm event. The flood potential, in particular, experienced notable reductions, however, they gradually decrease with each increase in storm severity.
Create Your Own Website With Webador